


Bitcoin Volatility: A Comparative Analysis
Current Volatility Statistics
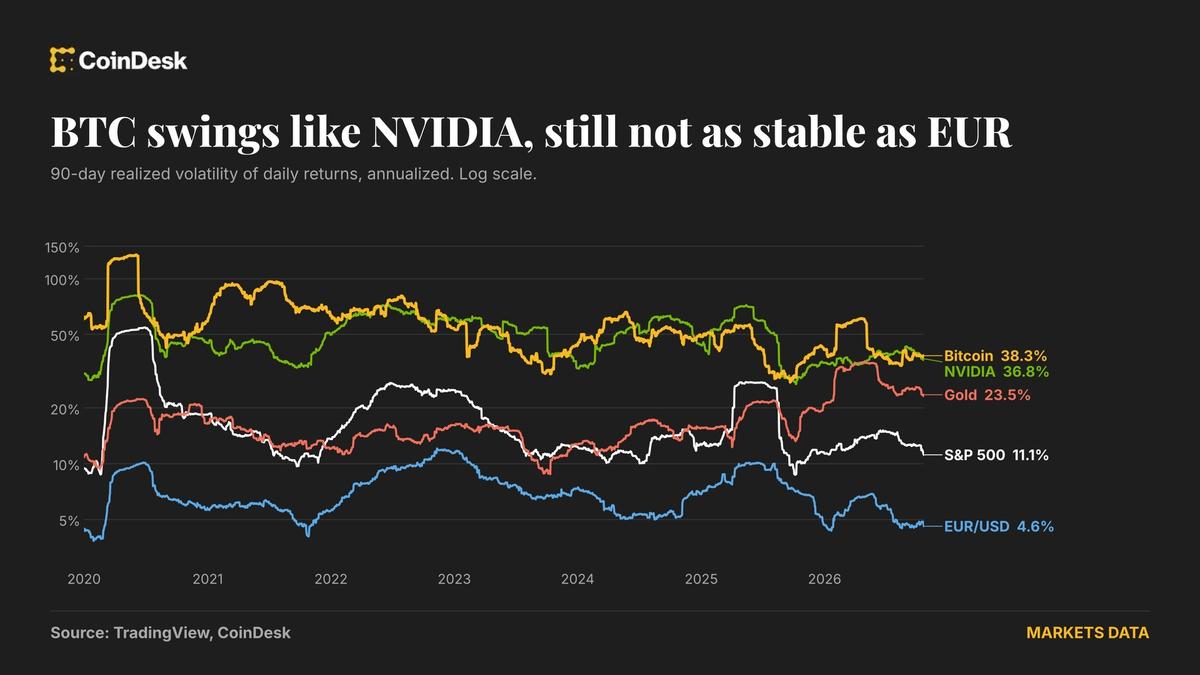
As of Thursday, Bitcoin’s 90-day realized volatility is approximately 38%, according to data from CoinDesk. This level of volatility is notably higher than that of its primary competitor, gold, which stands at about 23.5%. When compared to the S&P 500 index, which has a volatility of roughly 11%, Bitcoin exhibits over three times the volatility of traditional stock markets.
Comparative Stability of Currency Pairs
The EUR/USD currency pair, which reflects the value of the euro against the U.S. dollar, has the lowest volatility among the assets discussed, recorded at only 4.6% over the same 90-day period. To put this in perspective, Bitcoin’s volatility is about eight times greater than that of this established currency pair.
Despite recent economic uncertainties impacting the euro due to French government debt concerns, the volatility of most fiat currency pairs remains minimal, typically below 10%.
Bitcoin Versus Traditional Assets
The findings highlight a significant gap for Bitcoin to bridge as it seeks to establish itself as a reliable medium of exchange akin to traditional currencies. Proponents of Bitcoin, known as ‘maximalists’, argue that the cryptocurrency surpasses fiat money in several aspects, but its high volatility continues to challenge this perspective.
A notable comparison can be drawn with Nvidia, which has a realized volatility close to 37%. This indicates that Bitcoin’s price fluctuations are comparable to those of leading technology stocks.
Recent Trends and Historical Context
Since January 2020, Bitcoin’s average volatility has been around 58%, with a peak reaching 134% in June 2020. The cryptocurrency’s calmest period occurred in September 2025 when the price surged past $100,000, resulting in a record low volatility of 27.5%.
